“Dividend Yield + Dividend Growth = Prospective Return”
Josh Peters, The Ultimate Dividend Playbook
Yield + Dividend Growth = Total Return Estimate. Such a simple formula, but you’ll see from US and Canadian examples that it’s also been surprisingly accurate. That said, it has some pitfalls to be aware of too.
Yield + Dividend Growth Estimate = Total Return Estimate
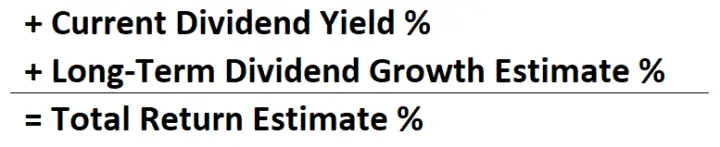
I use this formula to give me a really rough estimate of total returns going forward.
Rather than rely on it for an accurate total return I use it more as a weeding out process to avoid low total return stocks or to compare two investments I might be considering.
Fortis (TSE:FTS; NYSE:FTS) Example

Here’s an example of how you might use the formula to estimate future total returns.
Dividend Stocks Rock (DSR), Value Line, and Fortis company guidance are all estimating long-term dividend growth of 6%/year for the utility stock Fortis Inc.
Fortis also has a long history of dividend growth around the 6% mark with a similar payout ratio to what it has as I write this.
All said, I feel like 6% is a pretty reasonable long-term dividend growth estimate.
Now that we’ve got the hard part of the equation (the long-term dividend growth estimate) figured out, let’s add in the current dividend yield.
As I write this, the yield of Fortis Inc is 4.1% so putting it all together gives us an average annual total return estimate of 10.1% (4.1% + 6.0%).
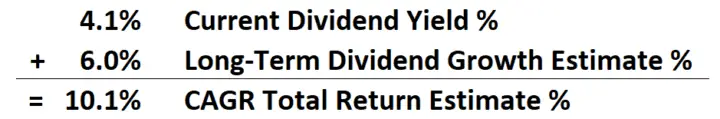
And that’s how you use this simple formula, Yield + Dividend Growth = Total Return, to estimate future average annual total returns.
Yield + Dividend Growth = Total Return Estimate Continued
My favourite investing book also uses a variation of this formula but adds in a quality element.
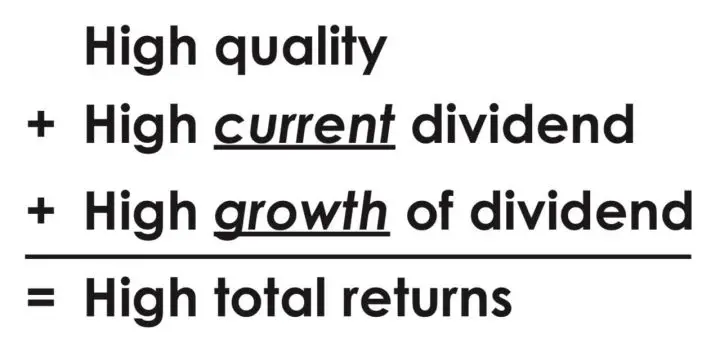
Source: Chapter 4, The Single Best Investment: Creating Wealth with Dividend Growth by Lowell Miller
TIP: I own the physical book, but Lowell Miller has a free PDF of The Single Best Investment: Creating Wealth with Dividend Growth on his Miller/Howard Investments website.
Quality is an important factor, but that’s a topic for another day, so let’s get back to the formula for estimating total returns:
It’s a handy formula because it’s not complicated and it gives you a sense of what a reasonable outcome might be.
Just remember that any time you use long-term estimates you are probably going to be wrong more than you are right.
With that warning out of the way, let’s look at an example highlighted by Daniel Peris in his book Strategic Dividend Investor to see just how accurate this formula has been in the past.
Testing the Total Return Formula Against US Stocks
With the help of Robert Shiller’s data set, Daniel Peris discovered that between 1926 and 2009 total return of the S&P 500 was 9.7% annually.
“The base yield represented 4.2%, and the dividend growth subsequently reflected in capital appreciation provided 4.4%. Not a quarter, not a half, but almost 90% of the market’s historical return has come from dividend payments.”
Daniel Peris, Strategic Dividend Investor
So in this example 4.2% + 4.4% = 8.6% CAGR total return estimate compared to the actual total return of 9.7%.
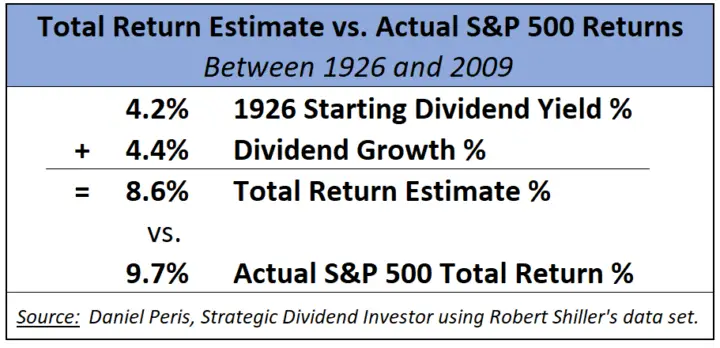
Not perfect, but close. After all, our estimate of 8.6% is ~89% of the actual total returns of 9.7%.
So, over long periods of time with a large group of US stocks, like the S&P 500, the formula was reasonably close.
I got curious about how accurate the total return formula was for Canadian dividend growth stocks so I did a little research myself.
Testing the Total Return Formula Against 78 Canadian Dividend Growth Stocks
First let me say that this isn’t going to be anywhere near as scientific as what Daniel Peris did for the US example we just went over, but it was still an interesting exercise.
I looked at 78 Canadian Dividend Growth Stocks and compared the actual 10-year total return from January 1, 2011, to December 31, 2020, to the formula for our total return estimate.
Remember the formula is: Yield + Dividend Growth = Total Return Estimate
So I took the yield at the beginning of 2011 and added the 10-year average annual dividend growth rate to get a total return estimate. Then I compared it to the actual total return for the same period. Here are the results:
The ones with the closest total return estimate compared to the actual total return are listed first. So, you’ll see at the bottom all the stocks where the gap between the estimate and the actual total return was far apart.
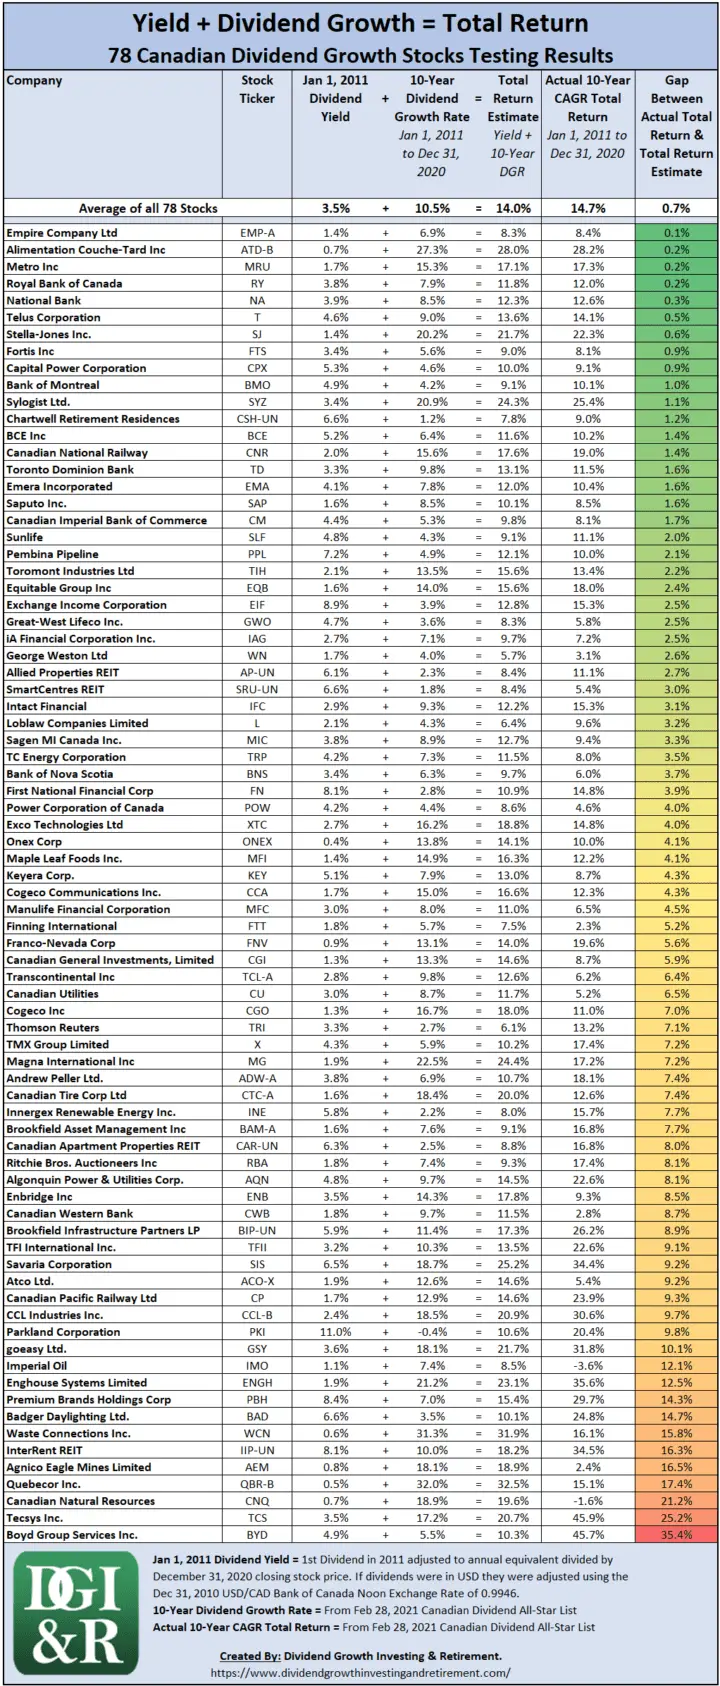
The results as a group were actually quite close. The average of the total return estimates ended up being 95% of the average of the actual total returns.
The average of all 78 total return estimates was a CAGR of 14.0%. This compared the CAGR of 14.7% for the average of all 78 actual total returns for January 1, 2011, to December 31, 2020.
Now you may be thinking, how did I pick these 78 Canadian Dividend Growth Stocks?
Well, I’m lazy so I just used the latest version of the Canadian Dividend All-Star list (CDASL).
The Canadian Dividend All-Star list is an excel spreadsheet with a huge amount of information on Canadian listed stocks that have increased their dividend for 5 or more years in a row.
For the free latest version of the CDASL subscribe below.
Subscribe to the Dividend Growth Investing & Retirement newsletter and you'll be emailed the download link for the most recent version of the Canadian Dividend All-Star List (CDASL).Download CDASL
As I maintain and update the CDASL on a monthly basis, I have most of the information needed to do this testing already.
So why these 78 companies? Mostly laziness on my part. I did say it wasn’t going to be very scientific 
In the February 28, 2021 CDASL there were 100 stocks with 5 or more years in a row of increasing dividends.
Not all of them had 10 years of dividend payments and some I didn’t have a 10-year total return for. These two factors dropped my initial 100 down to the 78 stocks I ultimately looked at.
Final Thoughts on my Lazy Test of 78 Canadian Dividend Growth Stocks
Using some back-of-the-napkin testing on my lazily picked 78 Canadian dividend growth stocks I found out that as a group the total return estimate was quite close (95%) to actual total returns.
While the group of stocks, when averaged out, was close to actual total returns there were still some wide variances among the individual stocks.
Boyd Group Services Inc. (TSE:BYD), for example, had a whopping actual average annual total return of 45.7% for the 10-year period from January 1, 2011 to December 31, 2020. This was way off from the total return estimate of 10.3%.
Pitfalls
When you shorten the time period and apply this to individual stocks, results will vary widely.
Pitfall #1 – No consideration for valuation
When the time period is shortened, the valuation of the stock is going to have a larger impact on total returns. Our simple formula of Dividend Yield + Dividend Growth = Total Return Estimate doesn’t take this into account.
- If the stock is undervalued, then over a shorter period of time I’d expect larger total returns than the formula suggests.
- Conversely, if the stock is overvalued, I’d expect lower total returns than the formula suggests.
Pitfall #2 – Individual stocks vs. a group of stocks are less reliable
We saw in our S&P 500 example that the formula was close (~89%), but when you use this total return estimate on individual stocks the formula becomes less reliable.
In a group of stocks, there are always going to be outliers that perform much better or much worse. When you use this formula on one stock, you don’t know if your stock is going to be an outlier or not.
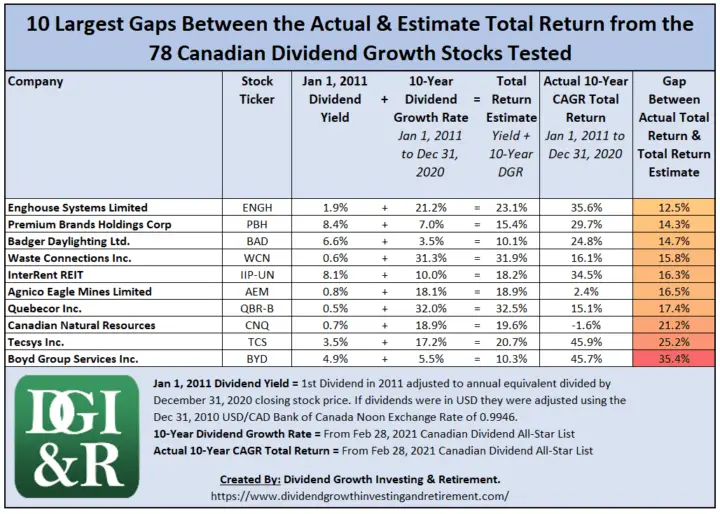
In the testing of the 78 Canadian dividend growth stocks, we saw that despite the group average being 95% of the actual total return you still had some large variances with some individual stocks in that group.
Here are the 10 Canadian dividend growth stocks with the widest gap between the actual total return and the total return estimate.
Pitfall #3 – Estimates are unreliable
This pitfall isn’t unique to the formula we are using to estimate total returns but applies to anyone using an estimate. When it comes to predicting the future, we just aren’t that good at it!
Bonus Video: Step-by-Step Instructions on Where to Find Long-Term Dividend Growth Estimates from Value Line, Dividend Stocks Rock & Company Guidance
A key part of the Yield + Dividend Growth = Total Return Estimate formula is finding reliable long-term dividend growth projections to estimate future total returns. Check out this short video to see exactly how I find these dividend growth estimates.
Bottom Line
Dividend Yield + Dividend Growth Estimate = Total Return Estimate is a simple formula, but it has its shortcomings.
Despite all the pitfalls, I still like and use the formula (Yield + Dividend Growth Estimate) as a quick and dirty total return estimate.
I find I’ll use it to weed out stocks with low total return potential vs. relying on it to give an accurate total return estimate.
Plus, it gives you a sense of what a reasonable outcome might be, and it’s also handy to use when comparing two investments.
The post Yield + Dividend Growth: A Simple Formula To Estimate Future Total Returns appeared first on Dividend Growth Investing & Retirement.